.svg)
Local Testing for Async Microservices & Third-Party APIs
How we built a developer-friendly local testing platform that accurately simulates real-world distributed systems scenarios with one-command deployment, complete isolation, and realistic third-party API mocking.
The Distributed Systems Testing Problem
Distributed systems teams face the same nightmare: Testing microservices that communicate through message queues, depend on third-party APIs, and process data asynchronously. This means they need to simulate quota errors, test high-concurrency scenarios, debug message flows, and validate error handling - all while providing a developer with their own isolated sandbox.
In our case, we are building a module that uses async services communicating through queues, and heavily relies on third-party APIs. These APIs enforce strict quotas along with databases and caches needing specific states, and feature flags.
Why Standard Testing Falls Short
Testing this traditionally meant:
- You couldn't simulate quota or rate limits
- There was no way to test the retry logic under stress
- Developers were juggling dozens of services and dependencies
- There were unknown resource requirements for new enterprise clients
- It was impossible to test infrastructure changes
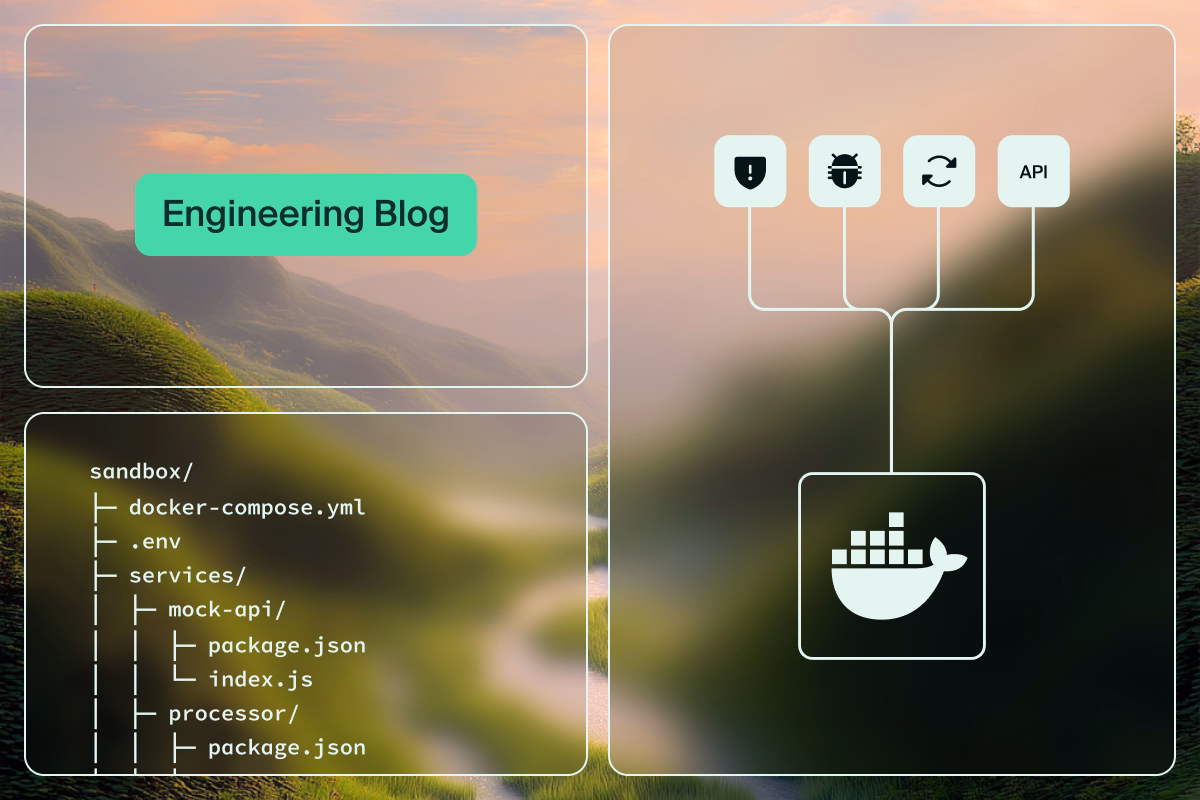
The Solution - Sandbox Everything
When we say "sandbox everything," we mean it. While you'd typically run microservices locally but connect to shared development queues and databases, we chose to containerize everything. Every component that would normally run in the cloud - your microservices, message queues, databases, third-party APIs - now lives in Docker containers on your local machine in complete isolation. This strategic choice meant no more fighting over shared test environments, dealing with queue pollution from other developers' tests, or worrying about breaking someone else's work.
Having the entire stack running in Docker Compose gives us:
- Complete isolation - No shared resources between developers
- Deterministic behavior - The same environment every time
- Fast iteration - Changes to mocks or services are reflected immediately
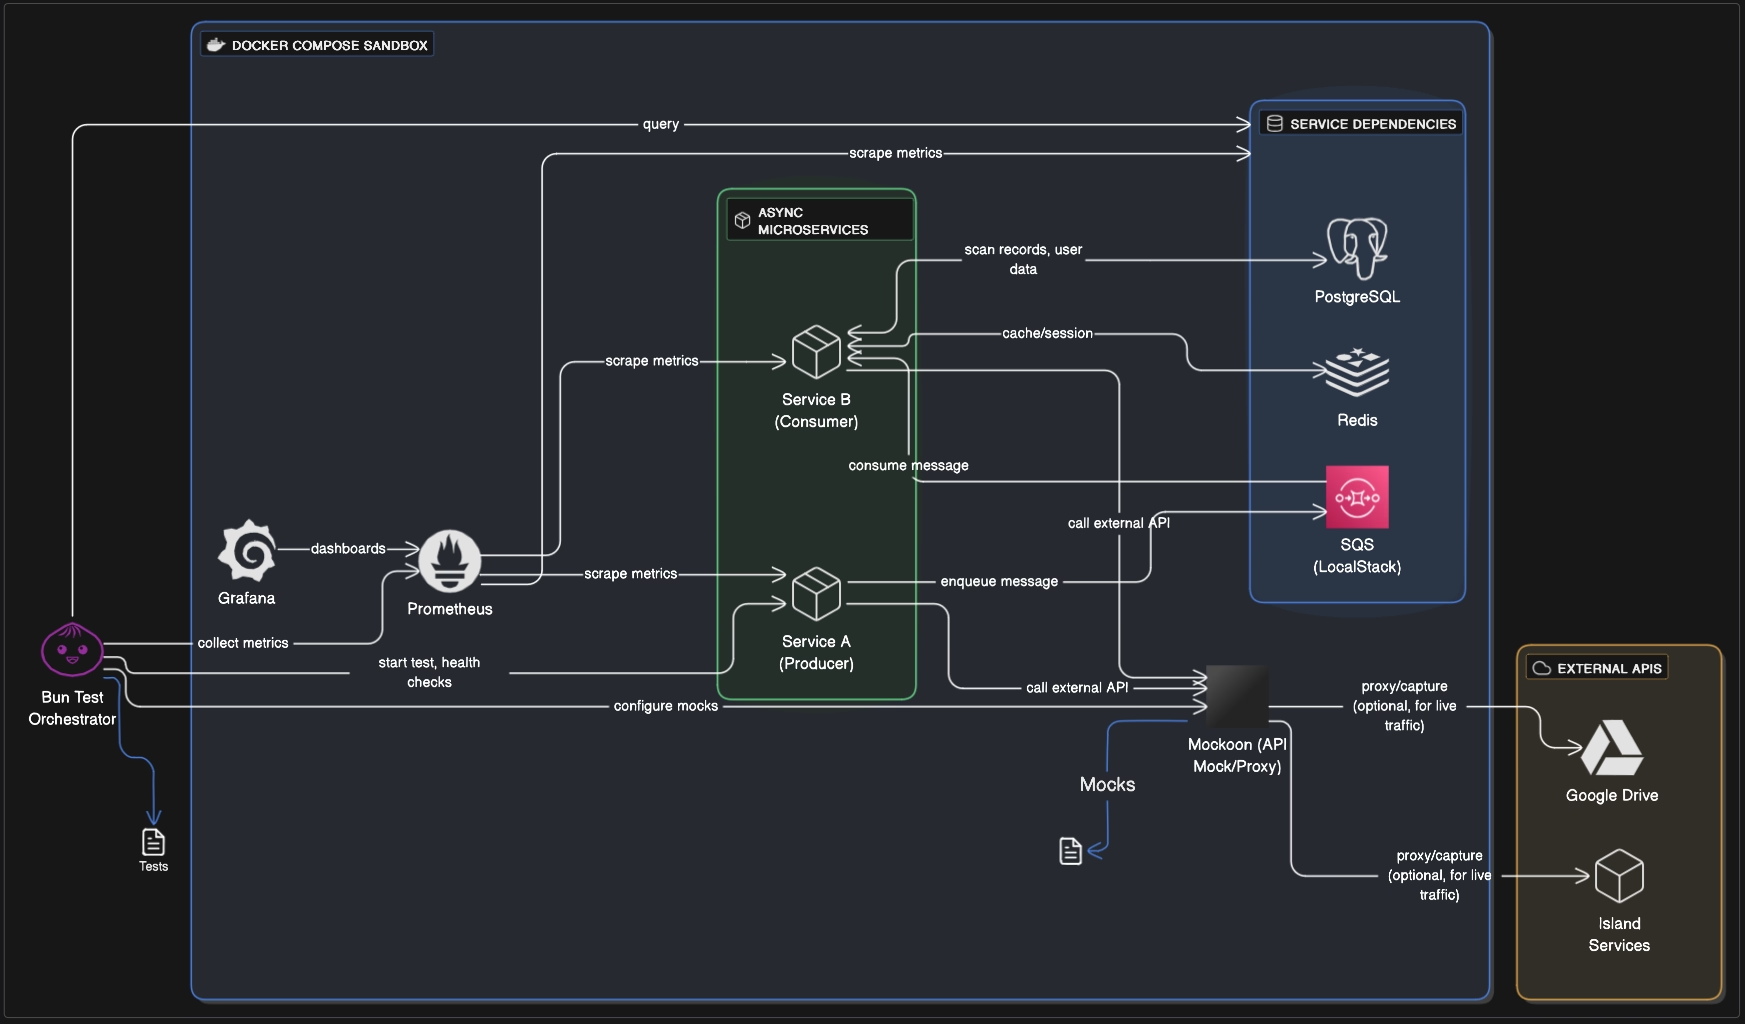
The Secret Weapon: Proxy-Based API Mocking
After evaluating several mocking solutions, we chose Mockoon for its unique combination of proxy capabilities, intuitive UI, and powerful templating. Unlike code-based mocking libraries that require constant maintenance, Mockoon provides a visual interface for managing mocks while still offering the flexibility of Handlebars templating for complex scenarios.
The real game-changer for us was using proxy-based traffic capture to build realistic mocks. Instead of manually creating hundreds of mock endpoints, Mockoon allows us to:
- Proxy Real Traffic - Point your services to a mock server instead of the real API
- Capture Live Requests - Let the proxy pass through to real APIs initially
- Convert to Mocks - Select which routes to mock with one click
- Control Response Latency - Configure realistic network delays or remove them entirely for rapid test execution
- Template with Handlebars - Transform static responses into dynamic templates with variables, loops, and conditional logic
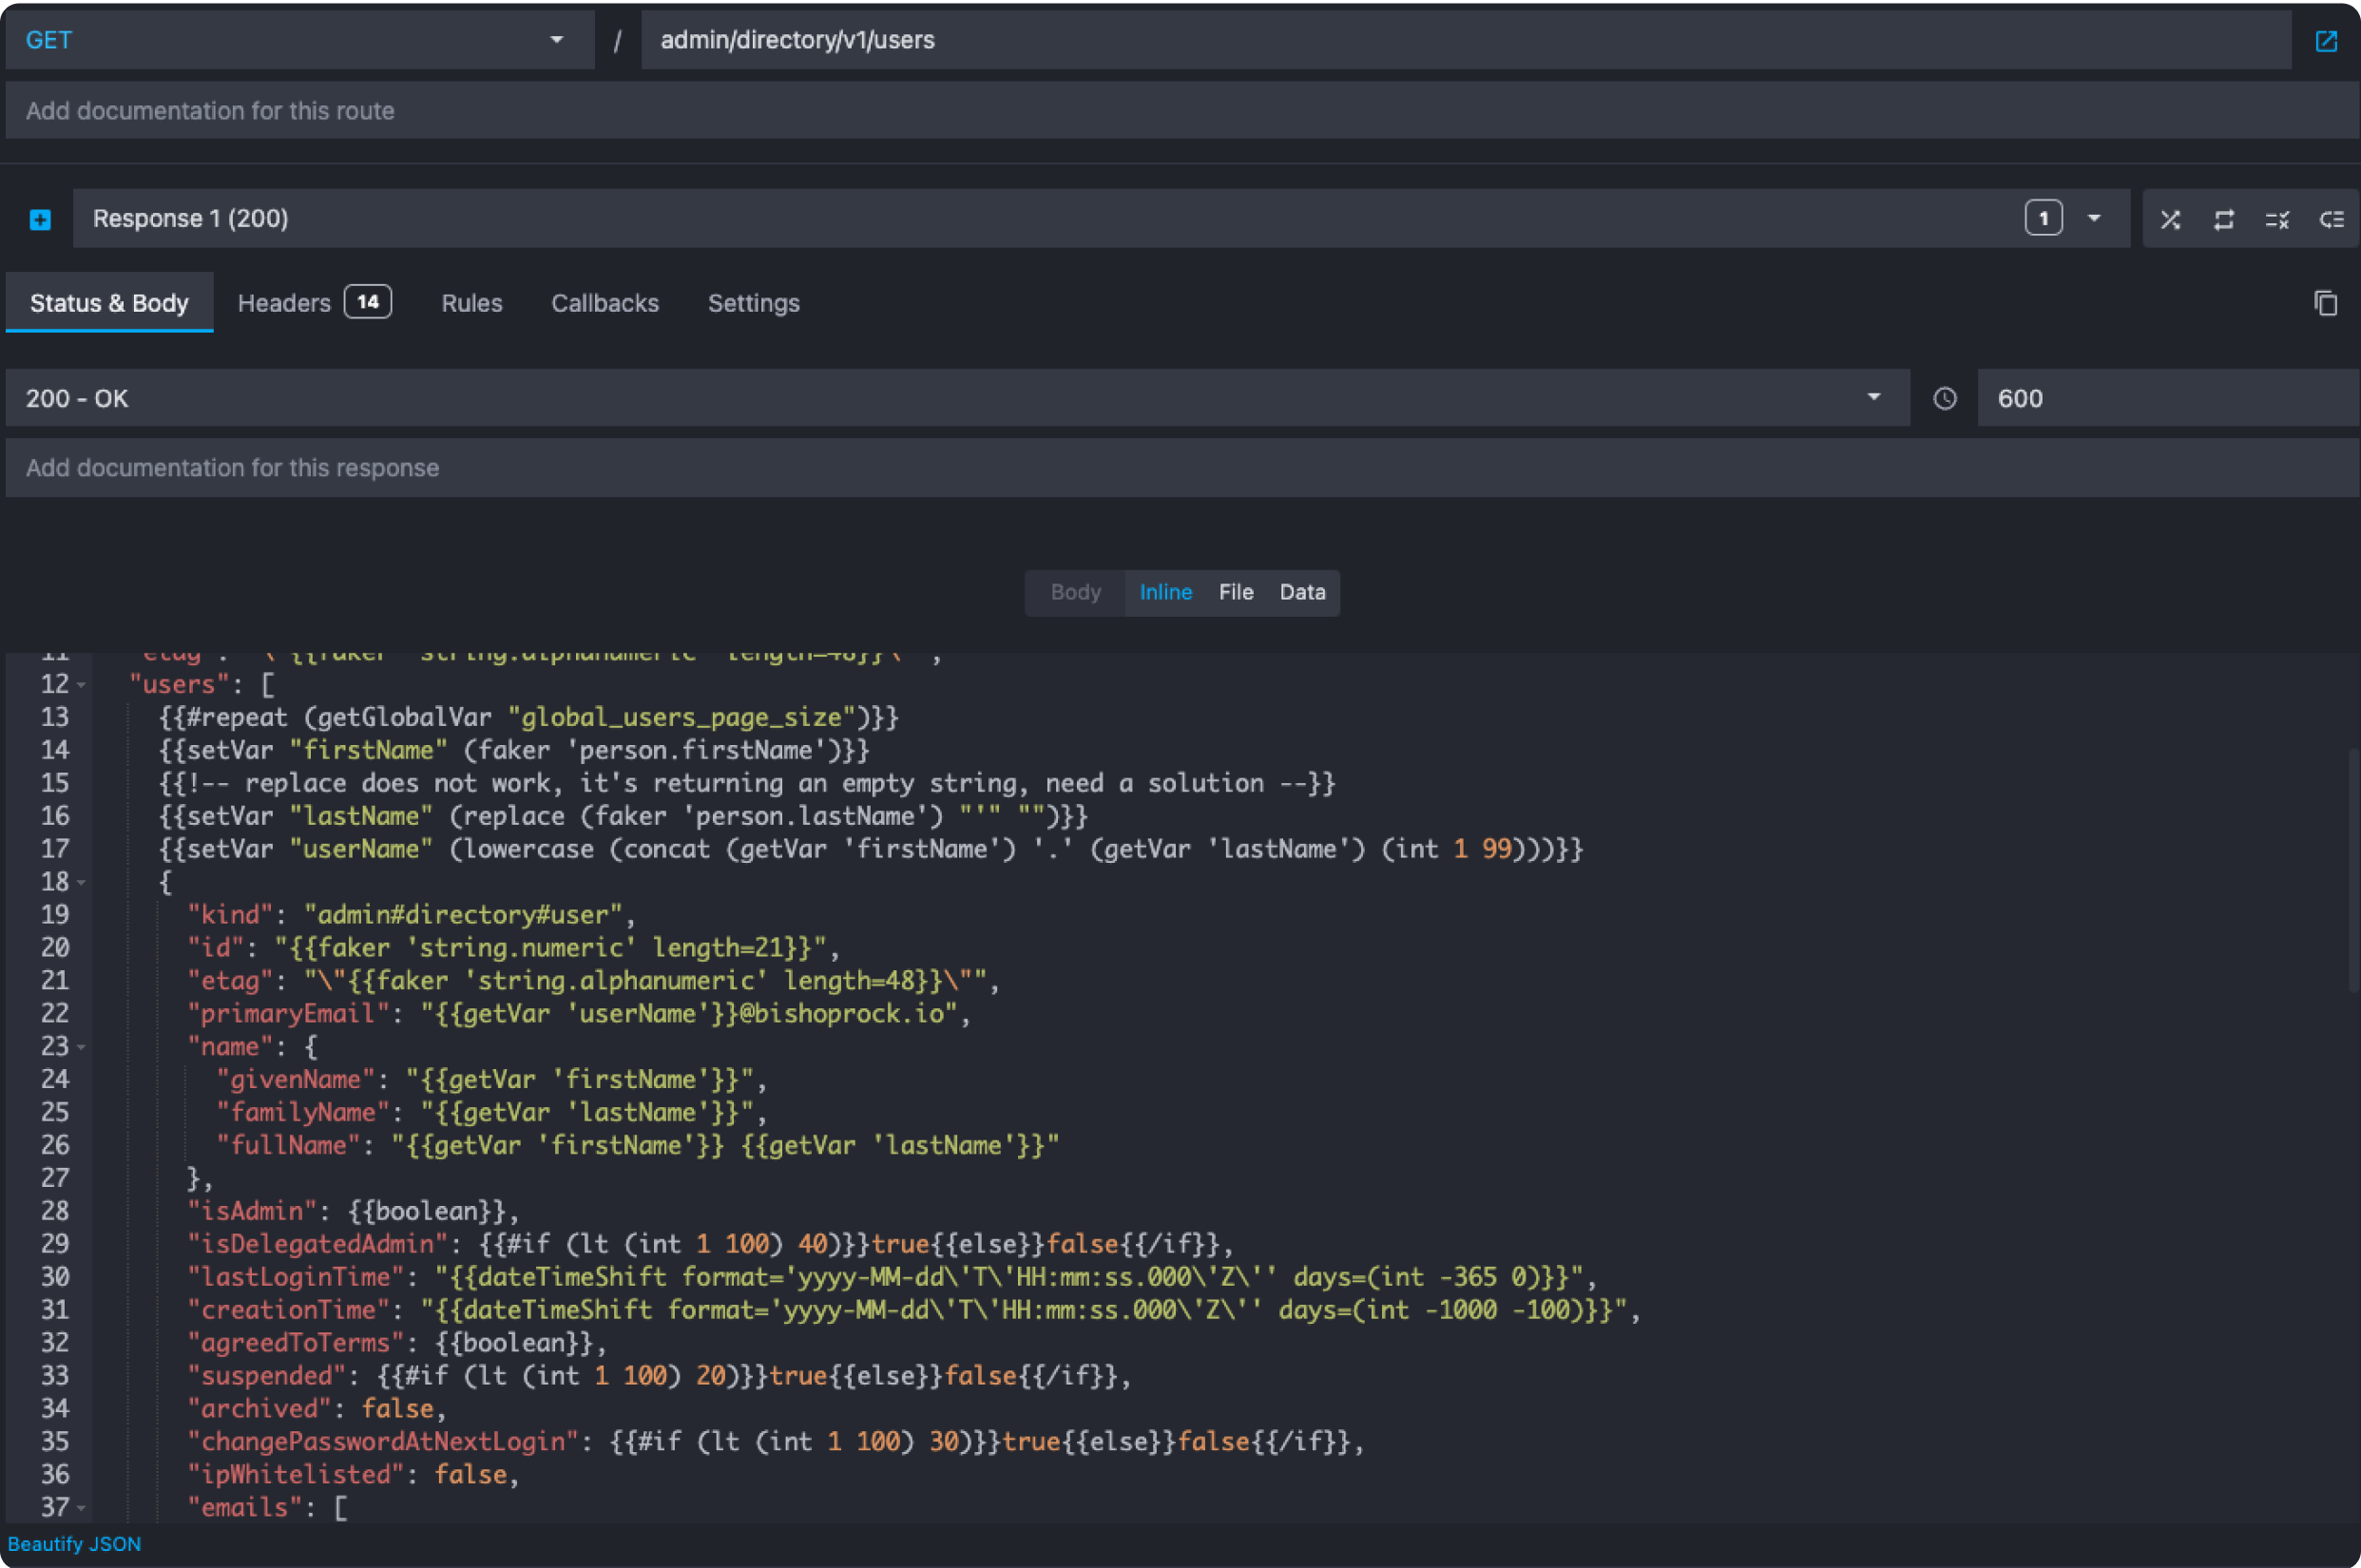
Here's an example of a complex third-party API request being mocked with dynamic Handlebars templating to generate realistic file metadata responses:
The Developer Experience: Local First, Cloud Later
Building Our Developer Experience
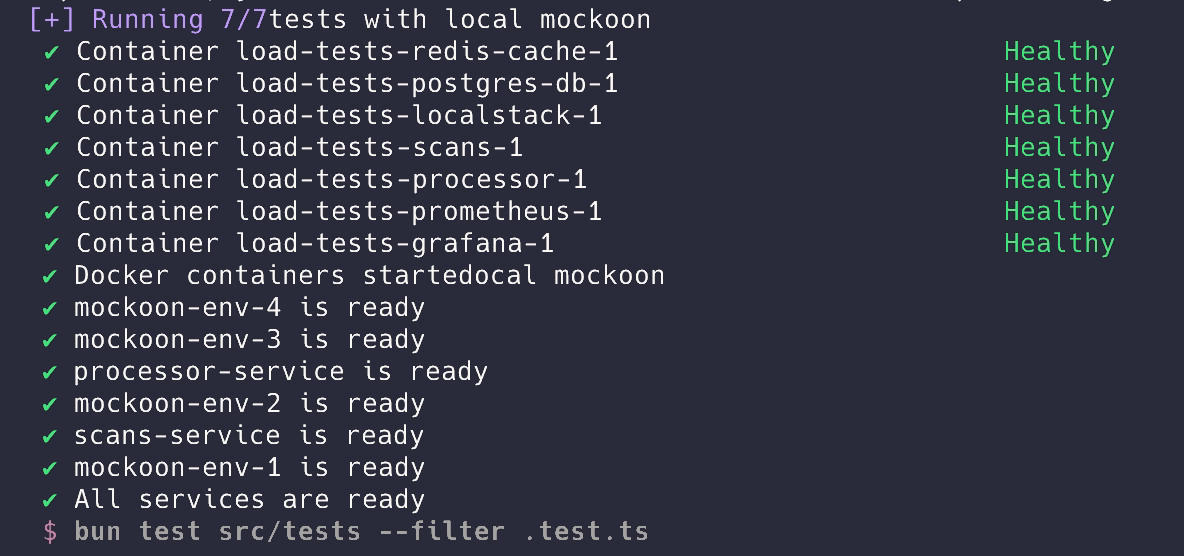
Although our core processing system runs on different tech stacks, we chose TypeScript for our test orchestration to ensure a fast, familiar developer experience. We built our test orchestrator using Bun (Node.js compatible) to control Mockoon's requests and responses while asserting against system metrics across all services.
bun startThat's it. One command spins up an entire testing environment locally. We chose Bun for its native TypeScript support and built-in test runner - no configuration needed, plus it runs noticeably faster than Node.js. Here's what happens behind the scenes:
- Authentication Checks - Validates access to any required services
- Infrastructure Spin-up - Docker Compose orchestrates all services
- Health Checks - Waits for all services to be ready
- Test Execution - Runs your configured test scenarios
- Real-time Monitoring - Dashboards show live metrics
We built two modes to support different workflows:
Mode 1: Pure Test Mode
This is the default, where everything runs in Docker. Perfect for:
- Pre-deployment validation
- CI/CD pipelines
- Quick regression tests
Mode 2: Development Mode
bun start --local-servicesThis mode starts all resources in Docker but keeps your core services running independently on your local machine, enabling:
- Live API capture with UI
- Service debugging with breakpoints
- Real-time mock adjustments
- Controllable latency testing
Building Confidence Through Realistic Testing
The framework uses a builder pattern that makes complex scenarios readable:
testWithMetrics(
  createScenario()
    .withMessageCount(10000)
    .withConcurrentProducers(5)
    .withProcessingDelay(100)
    .withErrorRate(0.05),
  'High-volume message processing with 5% error rate',
  async (scenario) => {
    const results = await scenario.run();
    expect(results.deadLetterCount).toBeLessThan(100);
  }
  );
Each test run is automatically annotated in monitoring dashboards, giving us perfect correlation between test events and system metrics.
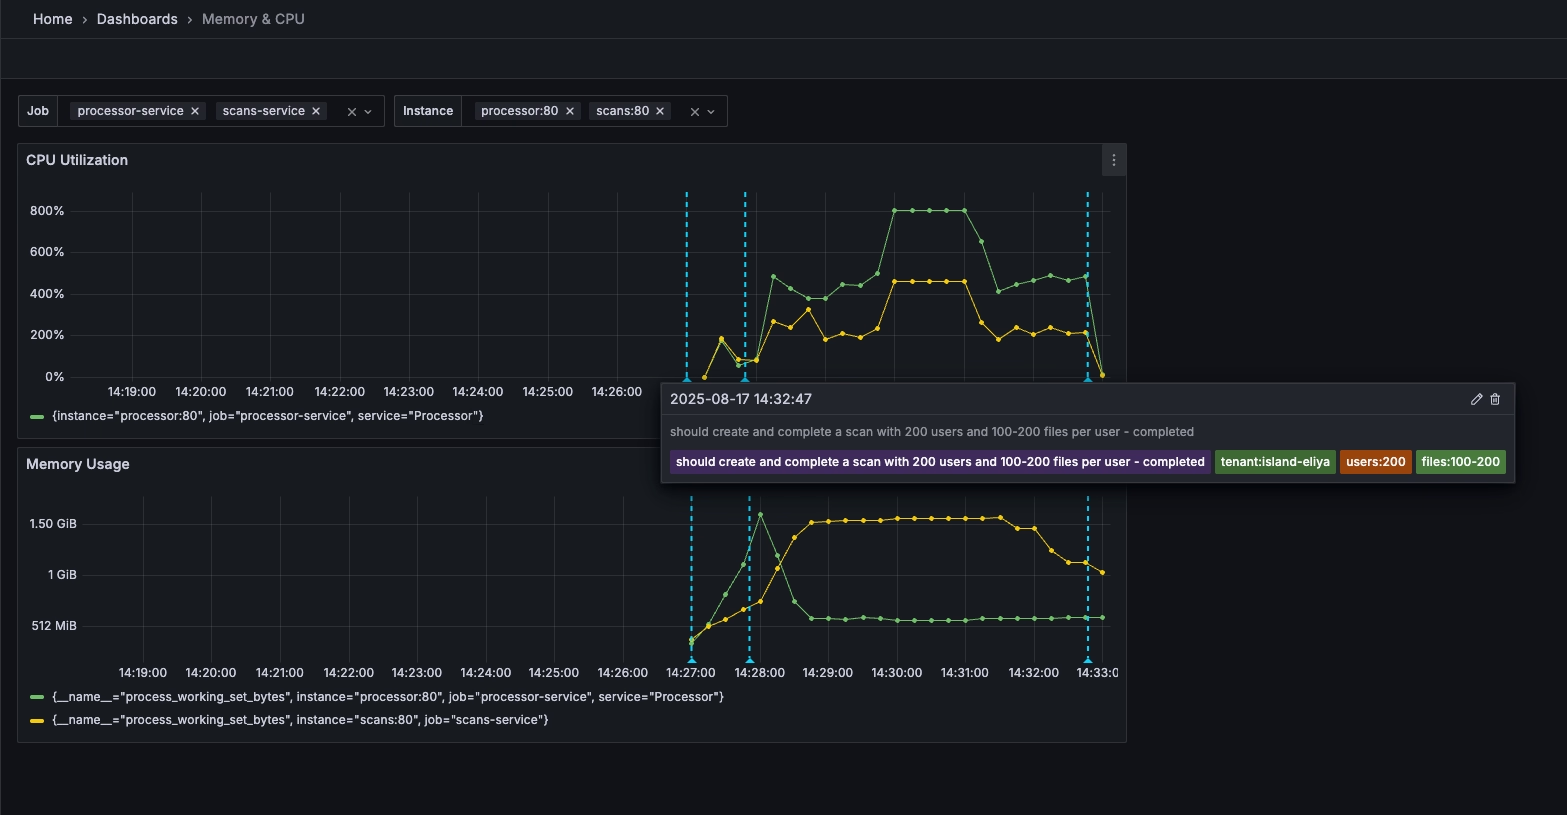
Taming the Async Beast: Making Queues Visible
Debugging async message flows is traditionally a nightmare. Messages disappear into queues, processing happens somewhere in the cloud, and when something fails, it can feel impossible to trace what happened.
Our solution: Local queues + real-time visualization using Prometheus and Grafana. Since we already had Prometheus metrics instrumented in our services for production monitoring, we leveraged the same metrics for local testing and created a dedicated test-focused Grafana dashboard highlighting the metrics that matter most during development.
If you don't have metrics yet, adding basic Prometheus counters and gauges is straightforward - most languages have lightweight client libraries that require just a few lines of code per metric.
With local queue simulation, we eliminated:
- Queue sharing between developers
- Network latency affecting test timing
- Production-like constraints limiting our testing
- Mysterious messages from other people's tests
But the real game-changer was visualizing queue behavior. We can now see:
- Correlation with system resources
- Message backlogs building up
- Processing rates dropping
- Dead letter queue activity
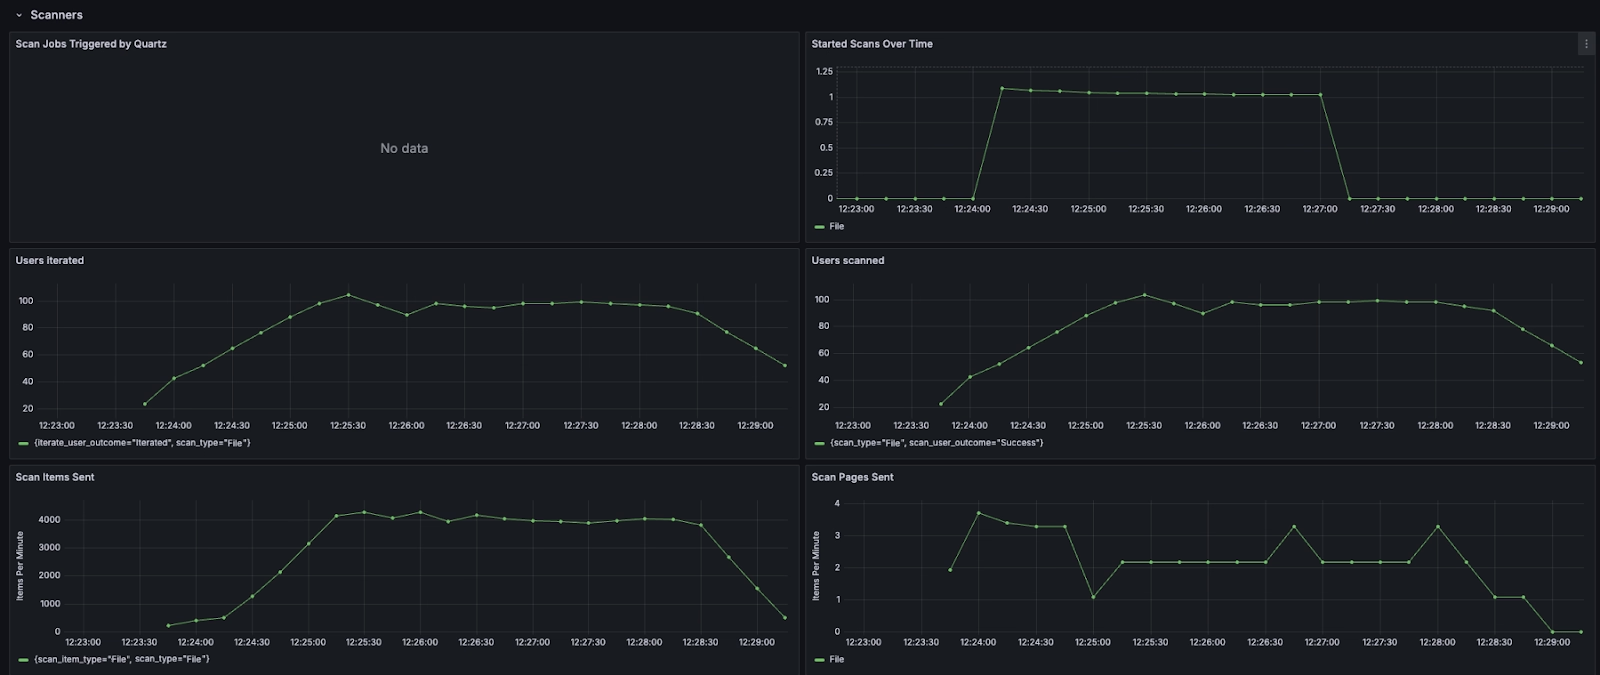
What Can Be Tested?
The real power of this framework lies in the comprehensive observability across every layer of the system. Unlike traditional testing, where you're limited to function outputs, we can assert against the entire distributed system's behavior.
Queue Metrics
- Queue call frequency - Track how often services poll queues via get-queue-attributes
- Message processing rates - Monitor successful event consumption across all queues
- Dead letter queue depth - Assert DLQ counts through LocalStack APIs or CloudWatch in production environments
Database State
- Data integrity - Direct database queries to validate stored values and relationships
- Resource utilization - Monitor PostgreSQL CPU and memory usage through Grafana dashboards
HTTP Traffic
- Request volumes - Track API call counts across all service boundaries and 3rd parties
- Error patterns - Monitor HTTP error rates and response codes via Prometheus metrics
System Resources
- Service performance - CPU and memory consumption for each microservice through integrated monitoring
This comprehensive visibility transforms how we write assertions. Instead of just checking return values, we can validate the entire system's behavior:
test('High-volume file processing handles quota limits gracefully', async () => {
  const scenario = createScenario()
    .withFileCount(1000)
    .withQuotaLimit(100);

  const results = await scenario.run();

  // Traditional assertions
  expect(results.successCount).toBeGreaterThan(800);

  // System-wide assertions
  expect(await getQueueDepth('retry-queue')).toBeLessThan(50);
  expect(await getDbRecordCount('processed_files')).toBe(results.successCount);
  expect(await getErrorRate('external-api-service')).toBeLessThan(0.1);
  expect(await getServiceMemoryUsage('file-processor')).toBeLessThan('512MB');
});
When a test fails, we don't just know that it failed - we know exactly where in the distributed system the problem occurred.
The Reality Check: Where Things Get Tricky
While our local sandbox approach has transformed our testing capabilities, it wasn't without its challenges. Here are the real hurdles we encountered and how we worked through them.
Complex Templates vs. Simple Mocks
Handlebars templating is powerful but has a steep learning curve. What starts as a simple JSON response quickly becomes a maze of conditionals, loops, and variable substitutions. Our team found themselves spending significant time debugging template syntax instead of focusing on test logic.
The Challenge: Real API responses aren't simple - they're often 500+ line JSON files containing lists of users, files, and permissions. While Handlebars templates with loops actually make these shorter, they become significantly more complex to read and debug.
Island’s Solution: We leveraged Mockoon's data buckets to store static data like MIME types and permission matrices, then referenced them in templates. We also established team guidelines: start with static JSON, only add templating when you need true dynamic behavior.
Stateful API Interactions
Real APIs often require maintaining state across requests - pagination being the perfect example. When simulating a third-party file storage API listing endpoint, we needed to track which page each mock user was currently viewing to serve the next set of results.
The Challenge: Mockoon's stateless nature meant our pagination tests would reset on every request, breaking multi-page workflows.
Island’s Solution: We leveraged Mockoon's global state feature to maintain per-user pagination state. Each request updates the current page counter, allowing realistic pagination flows. It works, but it's definitely more complex than we initially anticipated.
Authentication Complexity
Third-party APIs often require user-specific authentication, which affects response content. Each user in our system has different file permissions, folder access, and organizational boundaries that need to be reflected in mock responses.
The Challenge: How do you simulate user-specific data when your mock server needs to know which user is making the request?
Island’s Solution: We created authentication wrapper clients that embed user context directly into request headers as plain text. Our Handlebars templates extract this information to customize responses per user. It's not elegant, but it enables realistic multi-user testing scenarios.
The Overhead Question
This approach requires significant upfront investment in Docker knowledge, multiple tools, and framework setup. For smaller teams or simpler applications, traditional mocking might be more appropriate. But if you're dealing with multiple third-party integrations and complex async workflows, the investment pays off quickly.
Real-World Discoveries That Saved Us
One of our modules processes enterprise file operations - syncing documents across cloud storage providers, managing user permissions, and enforcing security policies. Each organization has unique user hierarchies, file structures, and permission models.
While local testing can't perfectly replicate production scale, it serves as powerful initial performance testing that catches critical issues early. For comprehensive scale validation, we also run these same tests on a production-like Kubernetes environment via Jenkins jobs. However, our local framework proved invaluable for rapid iteration and discovered patterns that would have been expensive to find in higher environments.
Running thousands of test scenarios locally with realistic user and file distributions revealed critical patterns:
Discovery #1: We assumed user count would determine our scaling needs. Wrong. We discovered that one user with 1,000 files creates the same load as 1,000 users with one file each. When processing file permissions and sync operations, total file volume drives resource consumption, not user headcount. Our capacity planning had only set boundaries on user count, completely missing that file count per user was equally critical. This led us to implement adaptive rate limiting per user based on their file volume, and add monitoring dashboards that flag entities with abnormal delta rates - catching situations where a single user's bulk operations could overwhelm the system before they impact other customers.
Discovery #2: Our team implemented a new third-party integration for a cloud storage provider, and everything looked perfect in deployment. However, when running high-volume tests locally with proxy-based mocking, the request logs revealed something alarming - we were making N×N API calls where N was the number of users in an organization. The culprit? A missing authentication header that forced us to request the entire organization's file structure for each individual user instead of fetching it once per organization and filtering locally. Our production caching masked this catastrophic inefficiency, but the mock server's request viewer made it glaringly obvious. We caught this before onboarding a large customer with thousands of users who would have absolutely destroyed our API quotas.
Discovery #3: Quota limit errors and rate limiting were nearly impossible to test in production. With mock servers, we simply added error responses to simulate these edge cases and discovered our retry logic was actually making things worse. Instead of backing off gracefully, our system would hammer the same endpoint repeatedly, creating cascading failures across multiple file operations.
The Impact
- Test execution time: Hours of manual testing → 15 minutes automated
- Infrastructure cost: $0 (but that's not why we built it)
- Bug detection: Caught critical API inefficiencies and race conditions before production
- Developer confidence: Teams now test enterprise-scale scenarios as part of normal development
- Edge case testing: We can finally simulate quota errors, rate limits, and error cascades
Key Lessons for Testing Distributed Systems
1. Mock Early, Mock Realistically
Don't wait until you hit API rate limits; start with proxied traffic capture from day one. Modern mock servers make it trivial to go from zero to hundreds of realistic mocks in hours.
2. Make Async Flows Visible
Queue depths, processing rates, error counts - make them visible. Debugging async systems without dashboards is like driving at night without headlights.
3. Test Isolation is Non-Negotiable
Shared test environments become productivity bottlenecks that slow down entire teams. Container orchestration gives every developer their own complete environment.
4. One Command or Bust
If it takes more than one command to run tests, developers won't run them. We obsessed over the developer experience until bun start was all you needed.
Making This Work for Your Team
Whether you're building payment processors, data pipelines, or any async system, the principles we found most helpful are the same:
- Containerize everything - Your services, queues, databases, and mock servers
- Proxy your dependencies - Capture real traffic, then mock it
- Visualize your queues - You can't debug what you can't see
- Optimize for developer experience - One command, fast feedback, clear errors
The tools are all there: Docker Compose for orchestration, mock servers for API simulation, local queue implementations, and monitoring stacks. The challenge is putting them together in a way that doesn't feel like overhead, which is what Island’s sandbox environment is designed to do.

Elya is a Senior Software Engineer at Island, working as part of a team responsible for the development of enterprise security platforms and authentication system integrations. With nearly a decade of software development experience that spans across startups and large enterprises, Elya specializes in building robust infrastructure and enhancing developer productivity.

.png)


.svg)
.svg)

