.svg)
Debugging WinDbg with WinDbg: Fixing a Ctrl-C UI Freeze
We investigated why WinDbg sometimes freezes when you copy text from it. Turns out it’s because of clipboard synchronization logic when running it in a VM. Here’s everything we learned.
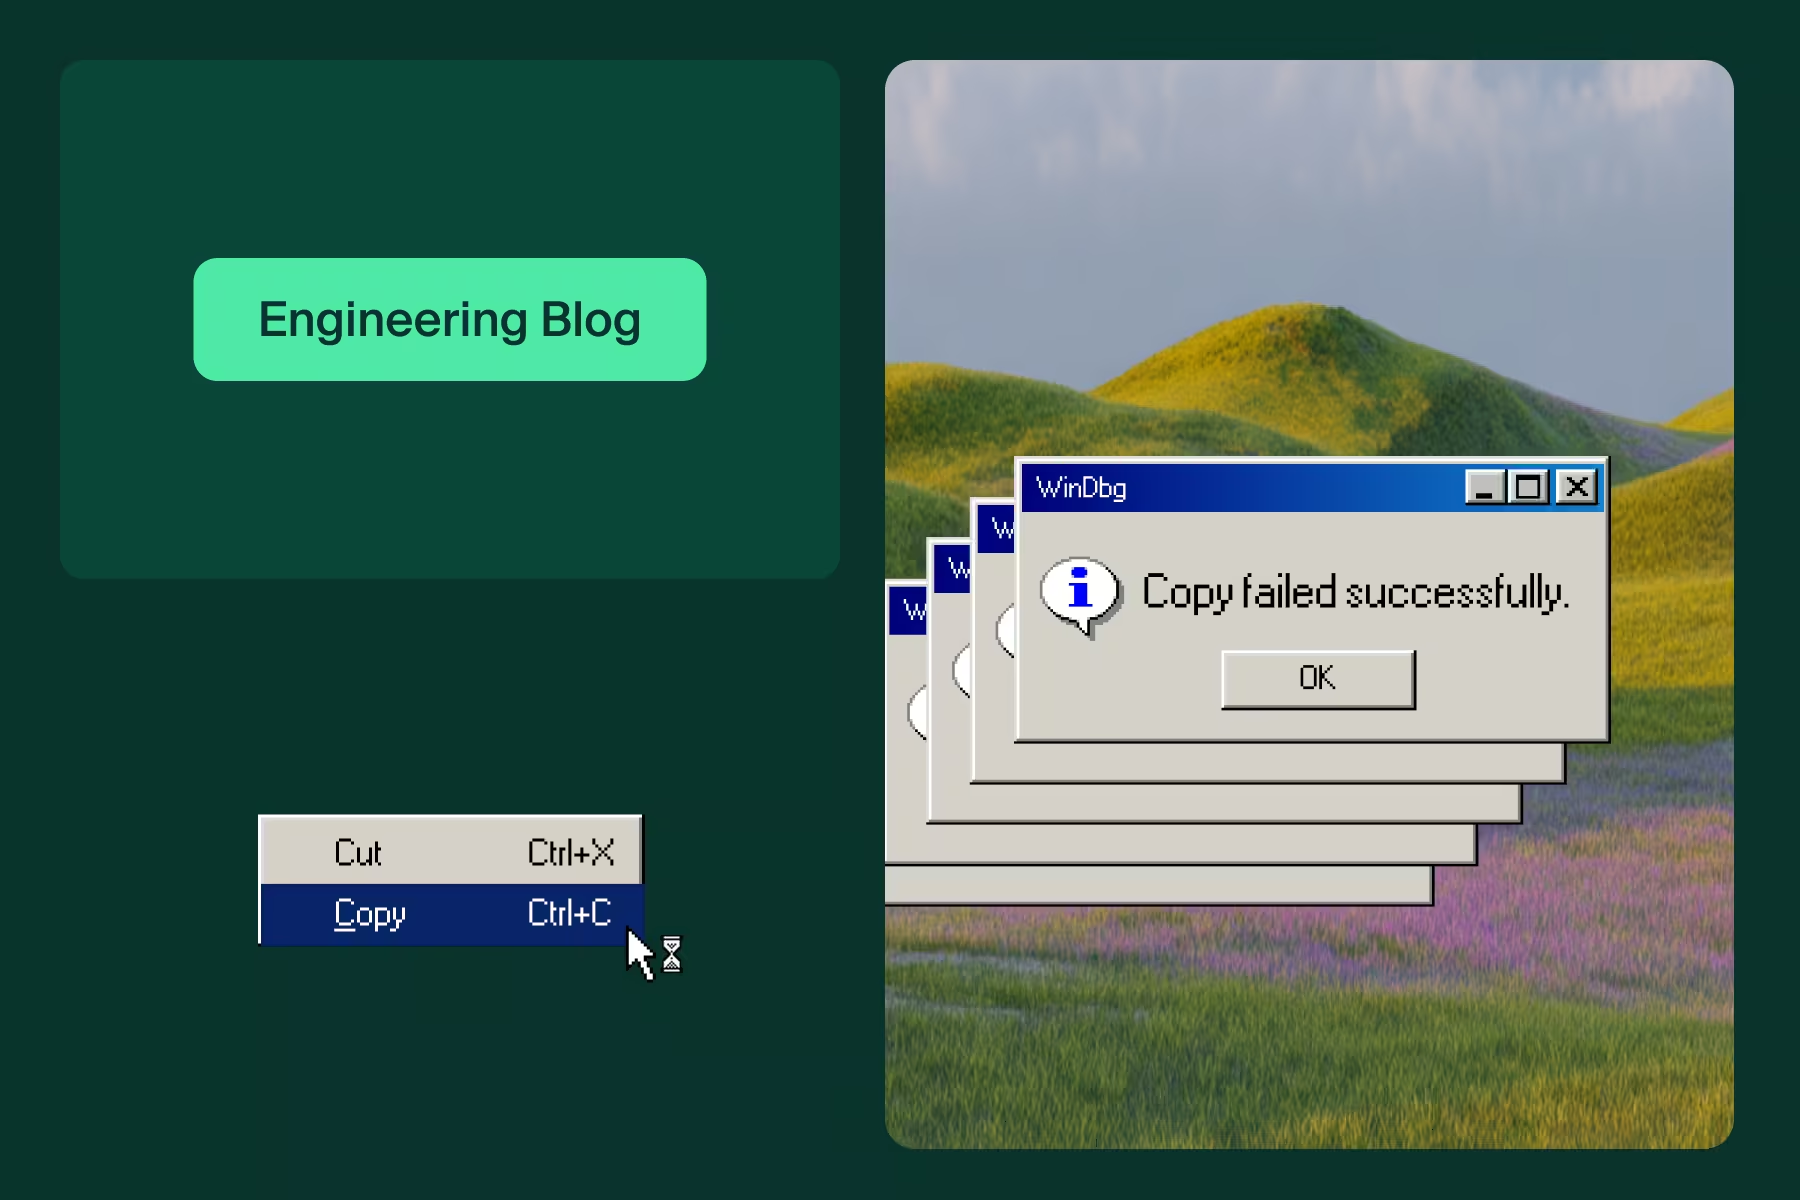
For years (literally years), I had this problem where WinDbg (Windows' debugger) would freeze for a few seconds whenever I would copy text from it. At Island, we’re building a lot of low-level OS products, so my colleagues and I have WinDbg open most of the time. When I asked them, some said they have this issue too, and some had never heard of it. I didn’t see anyone online report this. It looks like this:
Notice the delay between selecting “Copy” and the menu disappearing; the UI is frozen during this time. Finally, I’d had enough and I decided to get to the bottom of this issue.
In this blog post, I'm sharing an interesting journey through Windows' clipboard internals and the full investigation details.
TL;DR
The freeze is due to a deadlock in clipboard code, when an application reads the clipboard while WinDbg writes it. In my case, that happens when running a Windows VM on Linux. The participants are WinDbg, WPF, and SPICE’s vdagent, where:
- WinDbg calls WPF’s
Clipboard.SetDataObject()with copy = true. This call is done on WinDbg’s UI thread. - WPF puts delay-rendered content on the clipboard and repeatedly calls
OleFlushClipboard(), on the aforementioned UI thread. - Meanwhile, SPICE’s vdagent tries to synchronize the clipboard to Linux, which triggers delayed rendering, but it can’t complete since WinDbg UI’s thread is blocked.
- WinDbg can’t complete the clipboard flush since vdagent holds the clipboard open. This creates a deadlock.
If the above sounds interesting (or confusing) and you would like to understand it better and see the workaround, please read the full investigation.
The Investigation
Initial Triage
I started by debugging WinDbg in WinDbg. This might be confusing to follow, so I’ll make sure to call the WinDbg instance that I’m debugging the “child WinDbg” and the WinDbg that’s attached to it the “parent WinDbg”. I launched the “child WinDbg” and attached it to notepad.exe. I launched “parent WinDbg” and attached it to “child WinDbg”. Note that WinDbg runs in two processes:
- DbgX.Shell.exe—Manages the debugger UI, written in C#.
- EngHost.exe—Does the OS-level debugging calls, native code, communicates with the UI process over a named pipe.
The process getting stuck is the UI process so I attached to DbgX.Shell.exe.
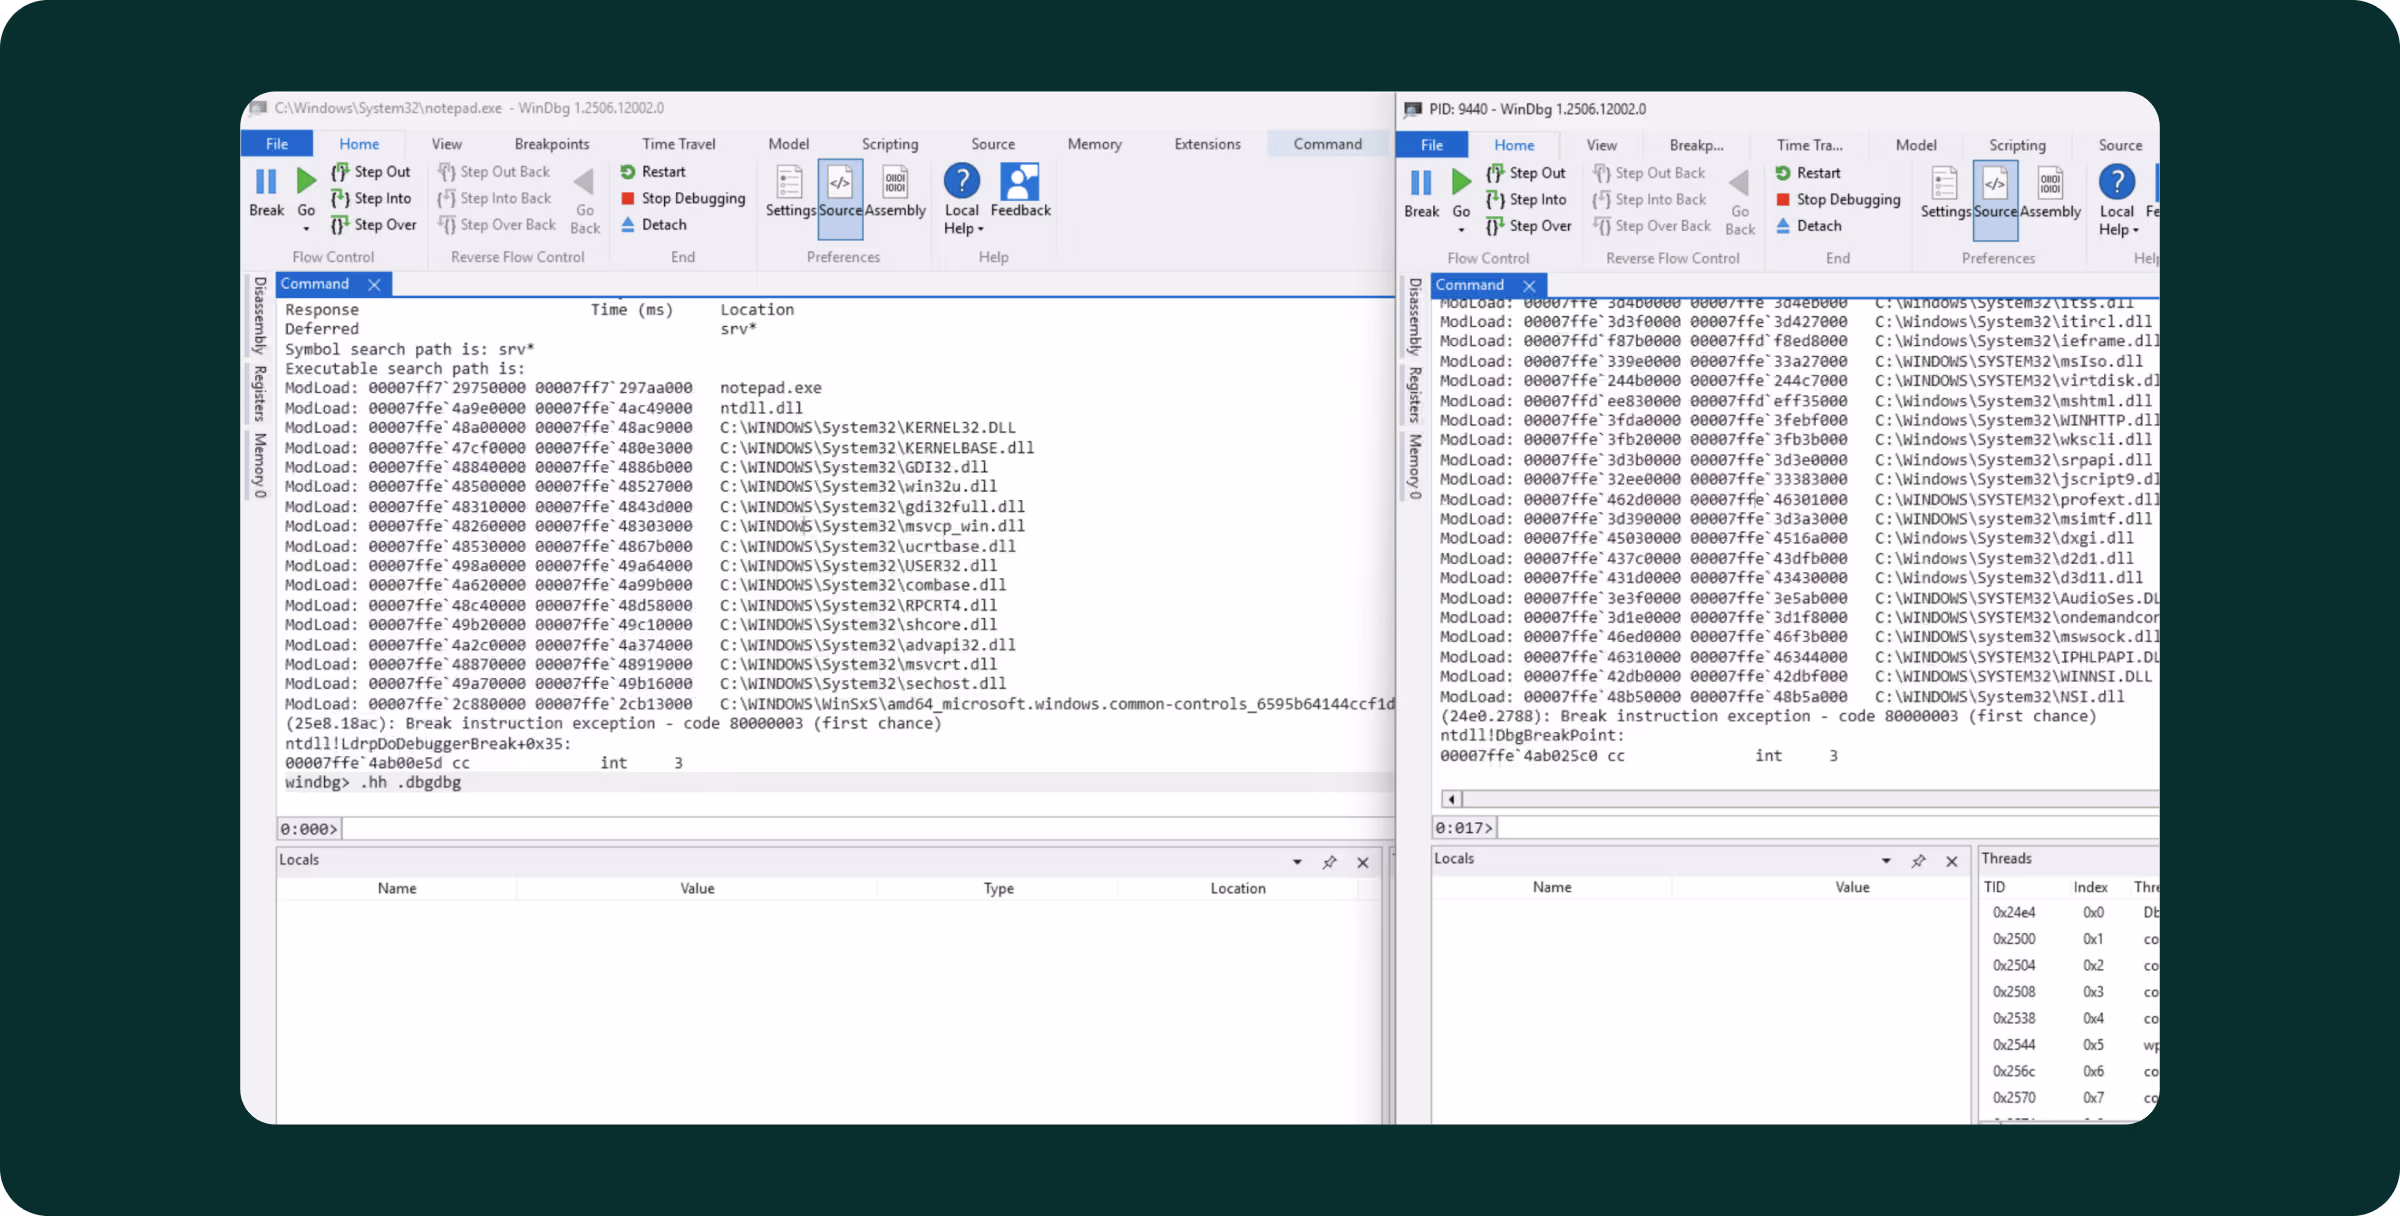
When I copy, the UI gets stuck for about 3–4 seconds, so my plan was to break the parent WinDbg while the child WinDbg is stuck and inspect the callstacks of all threads. Interestingly, it didn’t work:
- I pressed Ctrl-C in the child WinDbg to trigger the freeze, and it got stuck.
- I immediately switched to the parent WinDbg and tried to break it (either via the UI ribbon or with Ctrl-Break).
- The parent debugger’s UI didn’t respond for a few seconds, until the child debugger got unstuck, then the parent debugger stopped the child debugger.
- When the parent finally stopped and I inspected all callstacks
(~*k), they no longer showed anything interesting. Just a bunch of threads idling on functions likeNtUserGetMessage, NtWaitForWorkViaWorkerFactory, NtWaitForMultipleObjects, etc.
It’s surprising that the stuck child WinDbg affects the UI of the parent WinDbg, but it’s not the first time I came across strange Windows shell behavior when a UI process is stuck. (For example, you can suspend any UI application via System Informer, press Win+D to show the desktop and this operation won’t complete until the UI application is resumed.) This effect is interesting, but I didn’t have to follow this path since a new clue was revealed while I stopped the debugger.
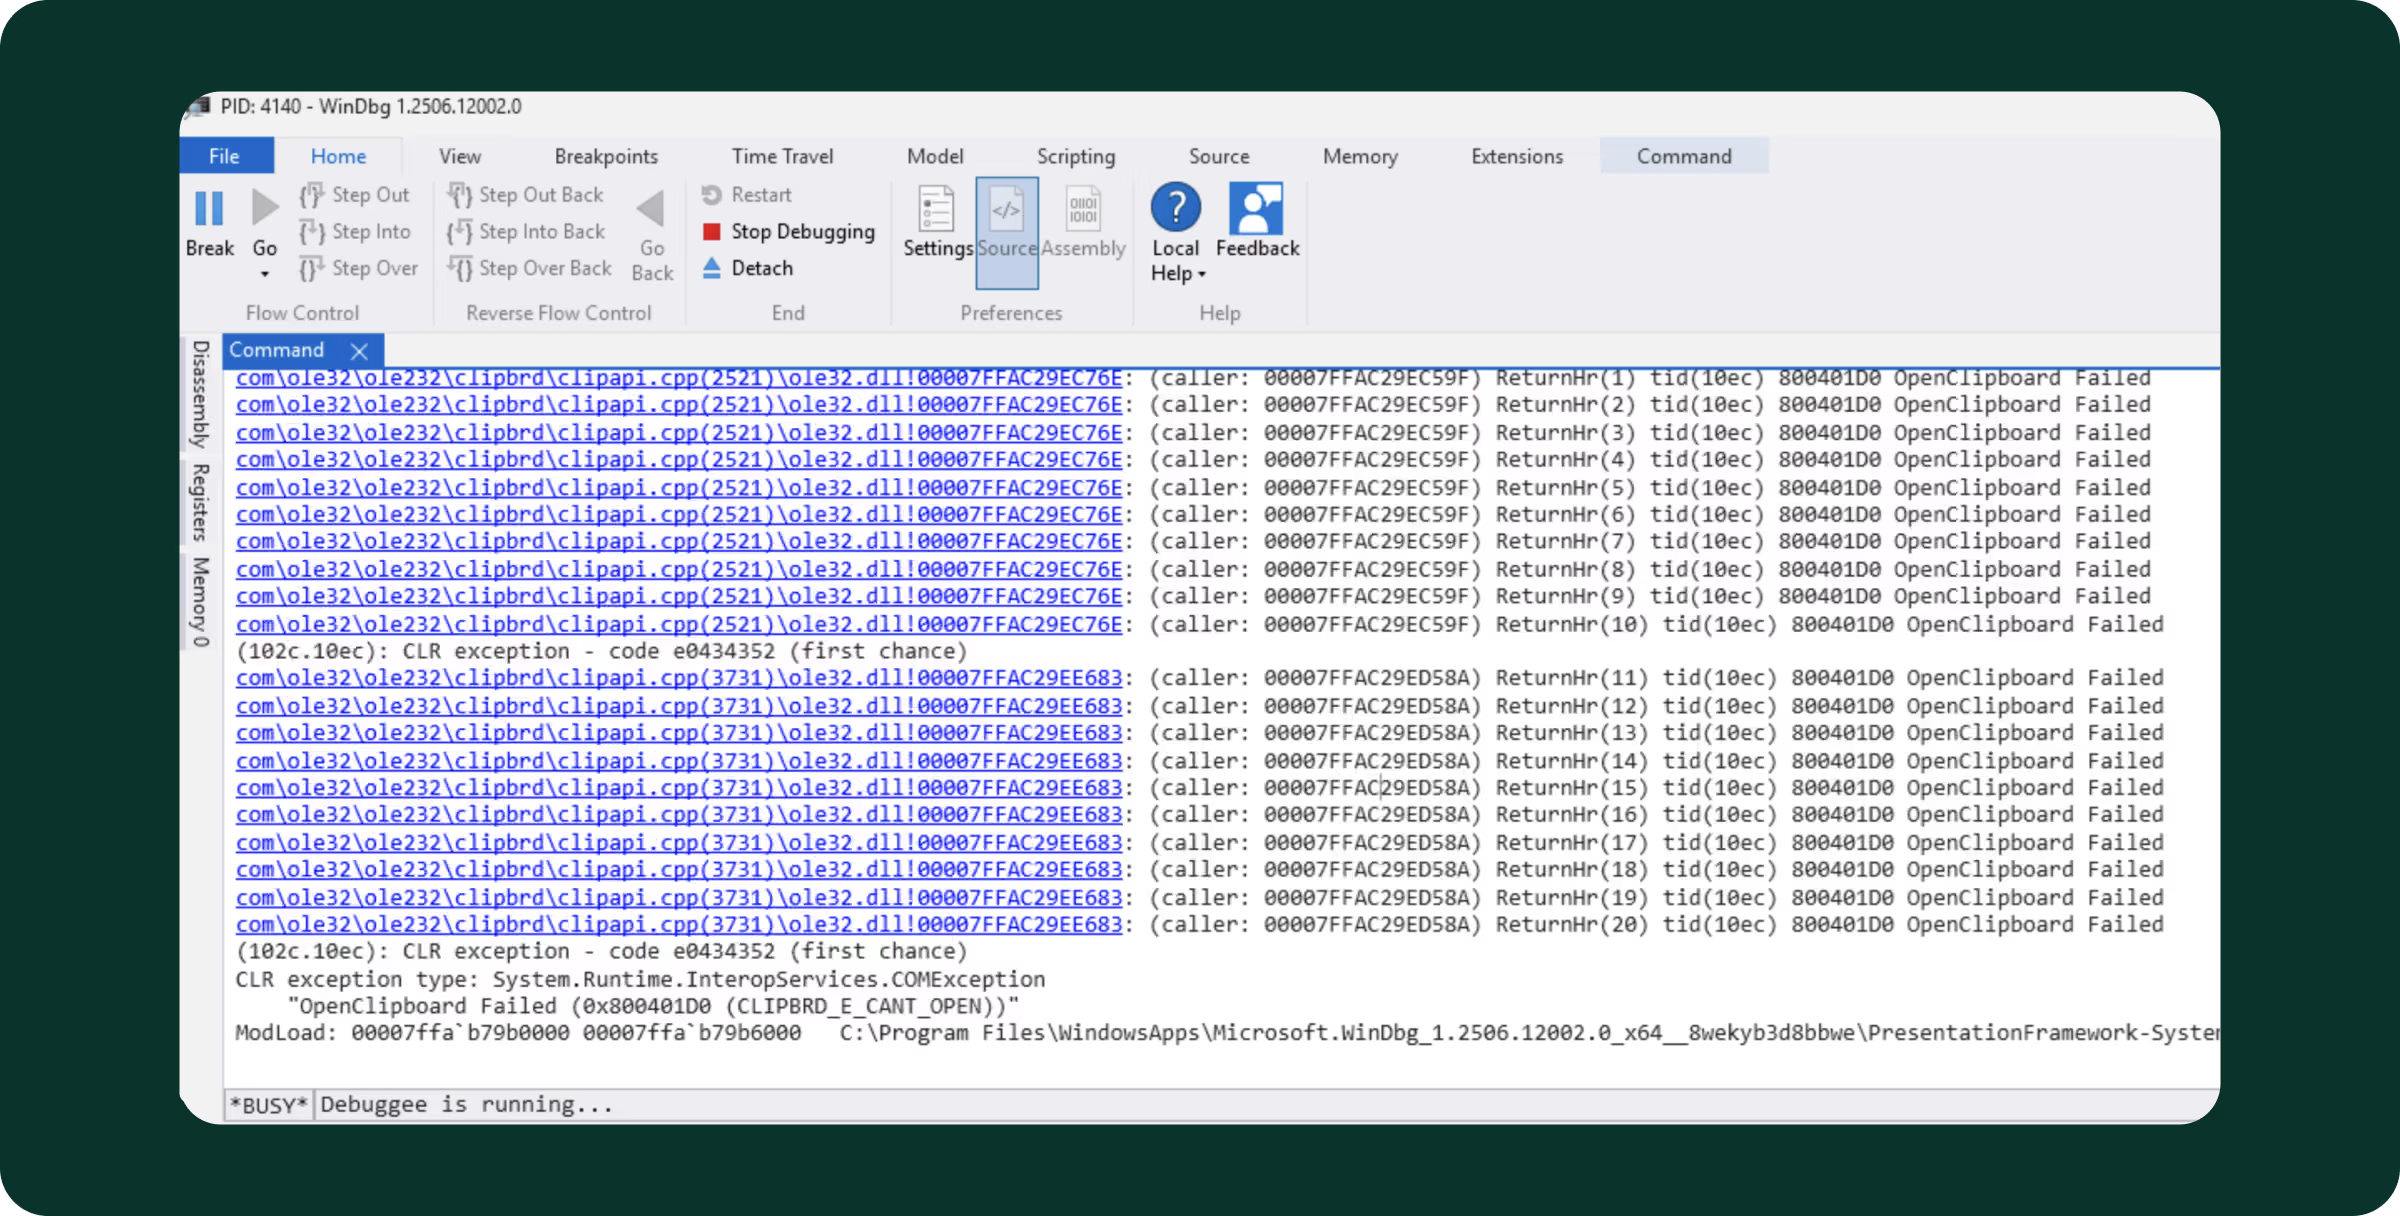
The clue is interesting debug strings printed to the parent debugger’s output. Turns out WinDbg has code that uses OutputDebugString, which means that when you attach a debugger to it, you get these strings:
com\ole32\ole232\clipbrd\clipapi.cpp(3731)\ole32.dll!00007FFAC29EE683: (caller: 00007FFAC29ED58A) ReturnHr(1) tid(10ec) 800401D0 OpenClipboard Failed
com\ole32\ole232\clipbrd\clipapi.cpp(3731)\ole32.dll!00007FFAC29EE683: (caller: 00007FFAC29ED58A) ReturnHr(2) tid(10ec) 800401D0 OpenClipboard Failed
[… repeated …]
com\ole32\ole232\clipbrd\clipapi.cpp(3731)\ole32.dll!00007FFAC29EE683: (caller: 00007FFAC29ED58A) ReturnHr(19) tid(10ec) 800401D0 OpenClipboard Failed
com\ole32\ole232\clipbrd\clipapi.cpp(3731)\ole32.dll!00007FFAC29EE683: (caller: 00007FFAC29ED58A) ReturnHr(20) tid(10ec) 800401D0 OpenClipboard Failed
(102c.10ec): CLR exception - code e0434352 (first chance)
CLR exception type: System.Runtime.InteropServices.COMException
    "OpenClipboard Failed (0x800401D0 (CLIPBRD_E_CANT_OPEN))"
In Windows, only one thread in the entire system can have the clipboard open at a time. (Technically, it’s per Window Station but that’s not relevant here.) The intended flow of the Win32 clipboard APIs is:
OpenClipboard(),which acquires exclusive access to the clipboard, so that no program can modify it concurrently.- If you want to write (i.e., you implement the Ctrl-C part), call
EmptyClipboard()followed bySetClipboardData(). - If you want to read (i.e., you implement the Ctrl-V part), call
GetClipboardData(). SetClipboardData()andGetClipboardData()receive a “format” argument such asCF_UNICODETEXTorCF_BITMAP, as the clipboard data can be in various formats.- Finally,
CloseClipboard(), to release the clipboard to other apps.
We see that WinDbg can’t open the clipboard, which means another process has it open. WinDbg retries a few times and gives up (CLIPBRD_E_CANT_OPEN). But, I see that the text does make it successfully to the clipboard (if I paste, I get the correct text). So, what’s happening?
I decided to trace the execution of the child WinDbg a bit. I put the following breakpoints in the parent WinDbg:
bp USER32!OpenClipboard ".echo;k;gc"
bp USER32!CloseClipboardStub ".echo;k;gc"
These breakpoints are actually “tracepoints”—the breakpoint’s command string (that is executed when the breakpoint is hit) resumes the execution after printing the stacktrace. The commands are:
.echo—Prints empty string for readabilityk—Prints stack tracegc—Resumes execution
This way, we get an overview of which clipboard functions are called and who calls them. The full traces are very long, if you want to check them out, check out the Gist. Here’s what I saw in high level:
- When we copy, we see that the main app thread eventually calls
DbgXUI.Utilities.ClipboardHelper.SetClipboardObject(). SetClipboardObjects()callsSystem.Windows.Clipboard.CriticalSetDataObject()from WPF (C# UI framework that WinDbg uses).CriticalSetDataObject()callsOleSetClipboard()from ole32.dll.OleSetClipboard()does the actual copy operations, and eventually callsOpenClipboard(),EmptyClipboard(),SetClipboardData()andCloseClipboard().
So far so good, the copy operation goes as planned and nothing is stuck. But the flow doesn’t end here, more clipboard functions are called:
- After
CriticalSetDataObject()is done,DbgXUI.Utilities.ClipboardHelper.SetClipboardObject()callsSystem.Windows.Clipboard.Flush()from WPF. Flush()tries toOpenClipboard()another time, but this time fails (printing “ReturnHr(2) tid(23fc) 800401D0 OpenClipboard Failed”).Flush()proceeds to retry opening the clipboard multiple times (many seconds). During this time WinDbg is stuck because the retries happen on the main thread.- Eventually
Flush()gives up.
This raises a few questions:
- Why is
Flush()needed in the first place? - Who holds the clipboard open for so long?
I started from the second question and tried to think which process could grab the clipboard and hold it open for a while. I was working on a clean Windows VM that is running under Linux, the only thing installed was WinDbg and… SPICE Agent!?!? Could that be it?
SPICE Agent
SPICE Agent is a service you install when running VMs on Linux to help the VM be more integrated in the graphical environment. It’s like VMware Tools or VirtualBox Guest Additions, designed to synchronize stuff like mouse position, resolution, and clipboard between the VM and the host. I decided to debug vdagent.exe, which is the service responsible for this synchronization.
I attached WinDbg to vdagent and put the following tracepoints:
bp USER32!OpenClipboard ".echo;k;gc"
bp USER32!CloseClipboardStub ".echo;k;gc"
bp USER32!GetClipboardData ".echo;rrcx;k;gc"
Note that in GetClipboardData(), I also printed the rcx register—that’s the first argument to the function and it holds the ID of the format that is requested. After performing a copy, I saw that vdagent was indeed slow, and the tracepoints show that:
- As soon as WinDbg copies new text, vdagent.exe wakes up and immediately calls
OpenClipboard()followed byGetClipboardData(CF_UNICODETEXT). - Then, nothing happens for a few seconds while the clipboard is held open and WinDbg is frozen.
- Then, vdagent calls
CloseClipboard()and WinDbg is unblocked.
“Gotcha!” I thought. I had evidence that there was some bug in vdagent that caused it to keep the clipboard open for too long. I headed to vdagent’s source at https://gitlab.freedesktop.org/spice/win32/vd_agent. However, the code was simple and looked solid: https://gitlab.freedesktop.org/spice/win32/vd_agent/-/blob/9c573c97545db8a58f1cc115f40073ea493bb356/vdagent/vdagent.cpp#L1314. It didn’t look like vdagent was doing something special, it was just reading the clipboard like a normal program…
I tried to disable vdagent (“Spice Agent” in services.msc) and the UI freeze went away. At least it explained to me why some colleagues had this issue consistently (they were running Windows VM on Linux) and some never had this (they were running Windows on bare-metal). But disabling it wasn’t a solution, so I re-enabled it and continued the investigation.
Next, I wanted to measure how long GetClipboardData() actually took in vdagent. I added a tracepoint on the return value of GetClipboardData():
bp vdagent+0x7655 ".echo;rrax;k;gc"(The offset vdagent+0x7655 is specific to my build, I took it from the stack frame that was right before the call to GetClipboardData().) The tracepoint showed that GetClipboardData() itself took a very long time. Meaning, vdagent was holding the clipboard open for a long time just because GetClipboardData() took a long time.
Delayed Rendering
This pointed to the next suspect: Delayed rendering. In Windows' clipboard API, there's a way to say, “I can provide data in a particular format, but I will render it on-demand when it’s requested”. This speeds up copy operations by avoiding the immediate generation of potentially expensive formats. For example, when copying a vector image from a graphics editor, the editor can provide the vector data instantly and only render a bitmap on demand if it’s pasted into a pixel-based editor.
On the Win32 API level, this looks like this:
OpenClipboard()+EmptyClipboard()like usual.- Call
SetClipboardData(format, NULL). Passing a NULL handle means that the format is available to be rendered on demand. CloseClipboard().- Later, when someone pastes the format, the source program receives a
WM_RENDERFORMATwindow message. When handling the message, render the format and callSetClipboardData(format, <data>).
Note that the rendering happens from a window message that is delivered synchronously to the source program’s UI thread, so the program must remain responsive for delayed rendering to work correctly. Let’s add another tracepoint in the parent WinDbg to inspect how WinDbg sets up delayed rendering:
bp USER32!SetClipboardData ".echo;rrcx;rrdx;k;gc"DbgXUI.Utilities.ClipboardHelper.SetClipboardObject(), which eventually callsOleSetClipboard(), which does:OpenClipboard(),EmptyClipboard()- A bunch of
SetClipboardData(), but most importantly:SetClipboardData(CF_UNICODETEXT, NULL). This meansCF_UNICODETEXTis delay-rendered. (The reason whyOleSetClipboard()always uses delayed rendering is beyond the scope of this blog.) CloseClipboard().
- At this point, vdagent.exe wakes up, calls
OpenClipboard()+GetClipboardData(CF_UNICODETEXT)and waits for the text to render. - But,
DbgXUI.Utilities.ClipboardHelper.SetClipboardObject()is trying toFlush(), so it keeps retrying to open the clipboard. We’re now in a deadlock: Flush() waits for the clipboard while blocking the UI thread and delayed rendering, vdagent.exe waits for the delayed rendering while holding the clipboard. - Eventually,
SetClipboardObject()gives up and the deadlock is released.
A note on flushing: Because the content is delay-rendered, the call to OleFlushClipboard() is done in order to make clipboard content available in case WinDbg crashes. Generally, when an application exits gracefully, it receives a WM_RENDERALLFORMATS message to render all its delay-rendered formats.
How to fix this?
So, who is responsible for the UI hang?
- WinDbg? I looked inside DbgXUI.dll, and I see that WinDbg calls
System.Windows.Clipboard.SetDataObject()with copy parameter set to true. This parameter causes PresentationCore to callOleFlushClipboard(). Since WinDbg runs this code on the UI thread, it exposes itself to deadlocks. I believe it’s incorrect to set copy = true on the UI thread. - WPF? Note that
System.Windows.Clipboard.SetDataObject()adds a sleep before callingFlush(), which increases the race window for the deadlock and makes it more likely. This issue happens to other people as well: - vdagent? I don’t think I can blame it, this program just registers a clipboard notifier and reads the clipboard when new data is available. A comment on issue 9901 on GitHub says that this deadlock was also observed with Windows’ own clipboard history service.
But at this point, Windows’ ecosystem has 40 years of layers and backwards compatibility, I don’t think I can confidently suggest a generic fix that won’t break something else. So my solution is to fix the immediate issue—WinDbg flushing the clipboard on the UI thread.
The fix
I used Windhawk, a program that can easily patch other programs in memory. I created a new mod that hooks OleFlushClipboard() in WinDbg and bypasses the function entirely. This isn’t a very elegant fix, but it finally solved the problem for me right there and then. Here’s the source code of the mod:
using OleFlushClipboard_t = decltype(&OleFlushClipboard);
OleFlushClipboard_t OleFlushClipboard_Original;
HRESULT WINAPI OleFlushClipboard_Hook() {
    return 0;
}

BOOL Wh_ModInit() {
    HMODULE ole32 = LoadLibrary(L"ole32.dll");
    OleFlushClipboard_t OleFlushClipboardExport =
        (OleFlushClipboard_t)GetProcAddress(ole32, "OleFlushClipboard");

    Wh_SetFunctionHook((void*)OleFlushClipboardExport,
                       (void*)OleFlushClipboard_Hook,
                       (void**)&OleFlushClipboard_Original);

    return TRUE;
}
You can download the mod from here: https://windhawk.net/mods/windbg-no-ole-flush-clipboard
What’s next?
I think I didn’t fully get to the bottom of this issue, because I noticed a few anomalies:
- Some clipboard monitors don’t trigger the deadlock. For example, NirSoft’s InsideClipboard with Auto-Refresh enabled is able to read the clipboard just fine.
- If you run a Windows VM in Hyper-V, the clipboard is successfully synchronized to the host without WinDbg freezing.
- On the other hand, when I wrote a trivial sample program to print the clipboard using
AddClipboardFormatListener(), the program did trigger the deadlock.
So, maybe there’s some subtle way to “correctly” monitor the clipboard that MSDN isn’t mentioning, the kind of thing Raymond Chen would write about. Had I wanted to dig further into this, I would have looked at the other clipboard monitors to understand what they do differently.
Since WinDbg is closed-source, I hope this blog will reach someone on WinDbg’s team and they can check if it really makes sense to call SetDataObject() on the UI thread with copy = true.

Nikita is an Engineering Manager at Island, working in the Core group. He has contributed extensively to Island’s Chromium code and now leads a team focused on low-level endpoint development. Before joining Island, Nikita worked in networking and virtualization and also dabbled in game development.

.png)
.svg)
.svg)

